
2026 LexisNexis U.S. Home Insurance Trends Report: Claims Severity Reaches All-Time High While Frequency Declines
PR Newswire
ATLANTA, July 22, 2026
New report underscores how climate events, inflation and geographic volatility are reshaping home insurance loss trends
ATLANTA, July 22, 2026 /PRNewswire/ — LexisNexis® Risk Solutions today released the 2026 LexisNexis U.S. Home Trends Report, providing an updated analysis of by-peril claims trends in the U.S. home insurance industry to help carriers make more informed, strategic decisions. Examining loss cost, claims frequency and severity, the report also offers insights into seasonality shifts, catastrophic claims and geographic patterns, including trends by U.S. state.
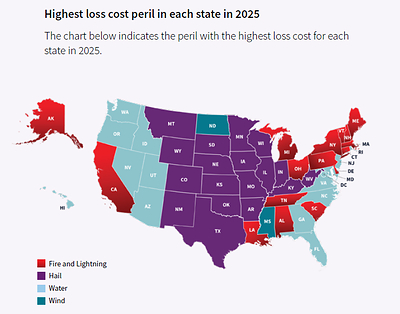
Key Takeaways from the 2026 LexisNexis U.S. Home Trends Report
- All Peril severity reached an all-time high in 2025, increasing 25.9% from 2024 and 93.2% compared to 2019. While All Peril loss cost decreased 4.4% and frequency decreased 23.8% from 2024 to 2025, loss cost remained the third highest in seven years and 50.0% higher than in 2019.
- The U.S. experienced 23 climate disasters with $1 billion or more in damages in 2025, totaling $115 billion in damages and marking the third highest year of billion-dollar climate events on record. The Los Angeles wildfires accounted for more than half of that total at $61.2 billion, demonstrating how a single catastrophic event can significantly affect loss trends.1
- Fire and Lightning were the defining perils of 2025, with loss cost increasing 76.8% and severity rising 67.3% year over year, driven largely by the January 2025 Los Angeles wildfires.
“U.S. home insurers continue to face increasing pressure and uncertainty as they contend with a ‘perfect storm’ of rising severity, rising inflation-driven replacement costs and a reshaping of loss patterns in the face of shifting climate-driven catastrophes,” said George Hosfield, vice president and general manager, home insurance, LexisNexis Risk Solutions. “The data reinforces the need for insurers to turn to multi-source datasets and analytics to help assess risk more accurately, benchmark performance and adapt to these volatile market conditions.”
All Peril Trends
- The U.S. home insurance industry continued to experience a long-term upward trend in loss cost across all perils combined. Although All Peril loss cost decreased in 2025, it was still the third most expensive year for loss cost within the last seven years.
- Severity rose significantly, reaching its highest level in seven years and increasing 93.2% compared to 2019. The rise in severity offset lower claim frequency, which continued its general downward trend since the beginning of the COVID-19 pandemic.
- Download the full 2026 LexisNexis U.S. Home Trends Report to explore how state-level loss cost and seasonality shifts are contributing to market volatility, including why California experienced the highest loss cost in 2025 and how wind and hail activity affected several central U.S. states.
Fire and Lightning Perils
- Fire and Lightning were the defining perils of 2025, with loss cost increasing 76.8%, frequency increasing 6.0% and severity rising 67.3% year over year from 2024. The dramatic increase was driven largely by the January 2025 Los Angeles wildfires, including the Palisades and Eaton fires.
- The fires cost an estimated $61.2 billion, making them the highest-cost climate disaster in the U.S. in 2025 and the costliest recorded wildfire in U.S. history.2
- Download the full 2026 LexisNexis U.S. Home Trends Report to see how the timing of the Los Angeles fires affected Fire and Lightning loss patterns, including a shift in the peril’s typical seasonality.
Wind and Hail Perils
- Wind loss cost decreased 50.4% and severity decreased 12.0% from 2024 to 2025, while frequency decreased 43.9%. The year-over-year decreases were likely driven by the lower number of catastrophe Wind claims in 2025.
- Despite lower Wind loss costs overall, wind-related risk remained significant. A central tornado outbreak in mid-March was the second costliest billion-dollar weather event of the year, costing an estimated $11 billion.3
- Hail loss cost decreased 38.4% in 2025 from its seven-year high in 2023, and frequency decreased 35.4% from 2023. Severity remained flat compared to 2024.
- Download the full 2026 LexisNexis U.S. Home Trends Report for additional context on catastrophe claims, billion-dollar hail events and the states most affected by severe convective weather across the central U.S.
Non-Weather-Related Perils
- Non-Weather-Related Water loss cost decreased 6.4% and frequency decreased 7.8% from 2024 to 2025, while severity rose 2.5%.
- Severity for the peril increased 63.16% between 2019 and 2025, likely due to inflation and rising material and labor costs associated with remediating water damage.
- Liability loss cost decreased 4.0% and frequency decreased 14.6% from 2024 to 2025, while severity increased 12.8% year over year. The report notes this may be anecdotal evidence of social inflation, a term that describes how liability claims costs are increasing above general economic inflation, related to increasing litigation costs.4
- Download the full 2026 LexisNexis U.S. Home Trends Report for additional findings on Theft and Other Perils, including how declining frequency and rising severity are contributing to shifting loss trends across non-weather-related claims.
“Broader loss trends are important, but they are only the starting point,” continued Hosfield. “The real opportunity for carriers is using those trends to help better understand what to look for at the individual-property level. If wildfire risk is expanding into new areas, carriers having insight into the fortification and condition of specific homes can help support more informed assessment decisions. If a state is seeing distinct water-loss patterns, understanding the interior risk characteristics of the properties they insure can be key. By connecting national, state and peril-level trends with more granular property intelligence, carriers can make more informed underwriting, pricing and portfolio decisions.”
Download the full 2026 LexisNexis U.S. Home Trends Report.
Click here to learn more about leveraging high-quality data and superior analytics to help deliver advanced risk management and identify new areas for growth.
About LexisNexis Risk Solutions
LexisNexis® Risk Solutions leverages the power of data, advanced analytics platforms and integrated AI solutions to provide insights that help businesses across multiple industries and governmental entities reduce risk and improve decisions to benefit people around the globe. Headquartered in metro Atlanta, Georgia, we have offices throughout the world and are part of RELX (LSE: REL/NYSE: RELX), a global provider of information-based analytics and decision tools for professional and business customers. For more information, please visit LexisNexis Risk Solutions and RELX.
Media Contact:
Syed Shabbir
Director, Communications
Insurance and Healthcare
LexisNexis Risk Solutions
816-572-7709
syed.shabbir@lexisnexisrisk.com
1 “2025 in Review: U.S, Billion-Dollar Disasters,” Climate Central, https://www.climatecentral.org/climate-matters/2025-in-review
2 “2025 in Review: U.S, Billion-Dollar Disasters,” Climate Central, https://www.climatecentral.org/climate-matters/2025-in-review
3 “2025 in Review: U.S, Billion-Dollar Disasters,” Climate Central, https://www.climatecentral.org/climate-matters/2025-in-review
4 “Social Inflation,” National Association of Insurance Commissioners (NAIC), https://content.naic.org/insurance-topics/social-inflation
 View original content to download multimedia:https://www.prnewswire.com/news-releases/2026-lexisnexis-us-home-insurance-trends-report-claims-severity-reaches-all-time-high-while-frequency-declines-302831584.html
SOURCE LexisNexis Risk Solutions


